Every JavaScript memory leak tutorial has the same structure: open DevTools, take a snapshot, look for detached nodes, done. None of them give you an actual leaky page to practice on. That is like teaching someone to swim by describing water.
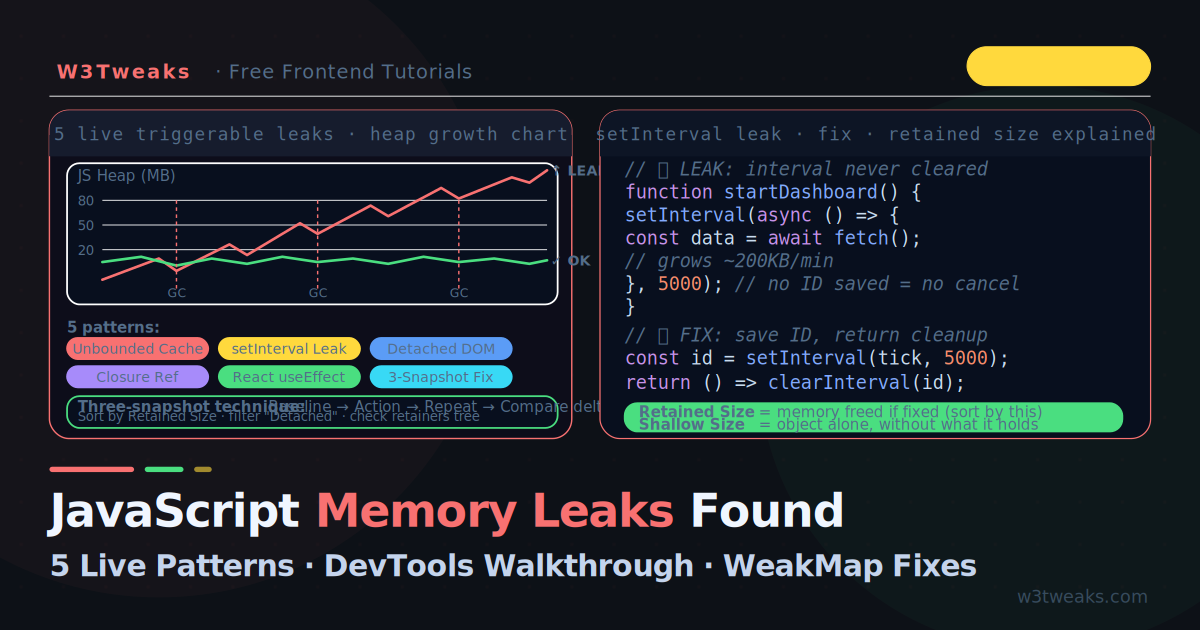
This tutorial is different. The demo below has six real memory leaks you can trigger with a button. Open Chrome DevTools in a second window, watch the heap grow, then follow the three-snapshot technique to pinpoint exactly which object is responsible. You practise the workflow, not just read about it.
This guide also covers what articles miss: the queryObjects(Constructor) console trick (the 10-second leak hunter), the ResizeObserver / IntersectionObserver disconnect asymmetry (these leak in all browsers; MutationObserver doesn’t), the AbortController unified-cleanup pattern that replaces the legacy isMounted flag, performance.measureUserAgentSpecificMemory() for production telemetry, and the FinalizationRegistry caveat (“may run late or never”) that nobody documents.
Related tutorials: Debounce vs Throttle · async/await Patterns · Event Loop Explained
Live Demo
Open Chrome DevTools (Memory tab) alongside this demo. Click 'Start Leak' for any pattern, watch the heap grow, then use the three-snapshot technique to find it. The Fix tab shows the corrected code for each pattern.
Symptoms: Does Your App Have a Memory Leak?
Open this checklist before reaching for DevTools. If your app has any of these symptoms, it almost certainly has a leak:
| Symptom | Most likely pattern |
|---|---|
| Tab gets slower over time, even with no user input | setInterval never cleared → Pattern 2 |
| Memory grows every time a component mounts/unmounts | React useEffect missing cleanup → Pattern 5 |
| Heap grows on each navigation in an SPA | Detached DOM nodes → Pattern 3 |
| A cache feature is using ever-increasing memory | Unbounded Map or array → Pattern 1 |
| Old event handlers firing for removed elements | Closures holding DOM refs → Pattern 4 |
| Memory creeps up but profiler shows nothing in your code | Observer not disconnected → Pattern 6 |
Triage Step Zero: Chrome Task Manager
Before opening DevTools, hit Shift+Esc to open Chrome’s Task Manager and sort by Memory. Use your app for a minute. If the row for your tab grows monotonically — never drops — you have a leak. This is the fastest leak smell test and almost no tutorial mentions it.
The one-minute test: DevTools → Performance tab → check Memory → record for 60 seconds while using your app normally → click the GC icon (trash can). If the blue line does not return close to where it started, you have a leak.
How JavaScript Memory Leak Detection Works (The 60-Second Version)
JavaScript uses a mark-and-sweep garbage collector. Every object in memory is either reachable (there is a path from the root — window, module scope, the call stack) or unreachable. Unreachable objects are freed.
A memory leak happens when an object becomes logically unused (you no longer need it) but remains technically reachable (something still holds a reference to it). The GC cannot know the difference — it only knows whether references exist.
Root (window)
  └─ myCache (Map)
       └─ entry: { data: 50MB dataset }   ← logically done, technically alive
The myCache Map still has a reference to the 50MB dataset. Until the Map entry is deleted or the Map itself goes out of scope, that memory cannot be freed.
JavaScript memory leak detection starts with one habit: take three heap snapshots, not one (covered in detail below).
Pattern 1 — Unbounded Cache (Grows Forever)
The most common production leak. A cache that fills on every request and never evicts old entries. The JavaScript memory leak fix is almost always the same shape: hold the handle, release it on teardown.
// ❌ LEAK: Map grows unbounded — every unique key adds permanent memory
const userCache = new Map();

async function getUser(id) {
  if (userCache.has(id)) return userCache.get(id);

  const user = await fetchUser(id);
  userCache.set(id, user);  // ← never deleted
  return user;
}

// After 10,000 unique user lookups: 10,000 entries in memory, forever
// Growth rate: depends on object size — typically 1–50MB/hour in production
Why it leaks: userCache lives in module scope — it is never garbage collected. Every unique id adds an entry that is never removed.
// ✅ FIX 1: Manual eviction with size limit (LRU-like)
const MAX_CACHE = 500;
const userCache = new Map();

function cacheSet(key, value) {
  if (userCache.size >= MAX_CACHE) {
    // Delete the oldest entry (Map iterates in insertion order)
    userCache.delete(userCache.keys().next().value);
  }
  userCache.set(key, value);
}

// ✅ FIX 2: WeakMap — entries auto-evict when the key object is GC'd
const userCache = new WeakMap();
// Only works when keys are objects, not primitives
// Perfect for DOM node → metadata associations
When to use WeakMap: Only when your cache key is an object (not a string or number). WeakMap entries are automatically removed when the key object has no other references — perfect for associating data with DOM nodes or request objects.
Pattern 2 — JavaScript Memory Leak from setInterval
A JavaScript memory leak from setInterval happens when the returned ID is discarded — clearInterval has nothing to cancel. The most dangerous leak for long-running SPAs.
// ❌ LEAK: interval runs forever after component mounts
function startDashboard() {
  setInterval(async () => {
    const data = await fetchDashboardData();  // closure holds `data` each tick
    updateCharts(data);
    logToHistory(data);       // history array grows with each tick
  }, 5000);
  // No reference to the interval ID → can never be cleared
}

// Every 5 seconds: new Promise, new data, new closure
// Growth rate: ~20–200KB per minute depending on data size
// ✅ FIX: Always save the ID and clear it on cleanup
function startDashboard() {
const intervalId = setInterval(async () => {
const data = await fetchDashboardData();
updateCharts(data);
}, 5000);
return () => clearInterval(intervalId);
}
// In React: return from useEffect
useEffect(() => {
const intervalId = setInterval(fetchAndUpdate, 5000);
return () => clearInterval(intervalId); // ← runs on unmount
}, []);The setInterval leak is particularly nasty because (1) the callback creates a new closure every tick, (2) if it holds a reference to a large object, that object lives until cleared, and (3) the interval itself is a root-level reference — it will never be GC’d unless explicitly cleared.
Pattern 3 — Detached DOM Nodes (Detached DOM Nodes Chrome)
A DOM node is “detached” when it has been removed from the document but is still referenced by JavaScript. The node and its entire subtree stay in memory.
// ❌ LEAK: holding a reference to a removed DOM node
let cachedList = null;

function showList() {
  cachedList = document.createElement('ul');
  for (let i = 0; i < 1000; i++) {
    const li = document.createElement('li');
    li.textContent = `Item ${i}`;
    cachedList.appendChild(li);
  }
  document.body.appendChild(cachedList);
}

function hideList() {
  document.body.removeChild(cachedList);
  // cachedList still holds reference to the <ul> and all 1000 <li> nodes
  // They are detached — not in the document — but not GC'd
}
// ✅ FIX: Null the reference after removal
function hideList() {
document.body.removeChild(cachedList);
cachedList = null; // ← now GC can collect the entire subtree
}
// ✅ Better pattern: don't cache the node at all — query it
function hideList() {
document.querySelector('#my-list')?.remove();
}To find detached DOM nodes in Chrome, filter the heap snapshot Class column for Detached:
- Memory tab → Heap snapshot → Take snapshot
- In the Summary view, type
Detachedin the filter box - Expand any
Detached HTMLDivElemententry - The Retainers pane at the bottom shows which variable is keeping it alive
- That variable name points you to the fix
Bonus — Edge DevTools: Microsoft Edge’s DevTools has a dedicated Detached Elements profiling type (separate panel in Memory) that surfaces leaked nodes without writing a filter query. Chrome will likely adopt the same UI recently.
Pattern 4 — JavaScript Memory Leak Closure
A JavaScript memory leak via closure is rarely the closure itself — it’s a long-lived listener holding the closure alive. Closures capture the entire scope they are defined in — not just the variables they actually use.
// ❌ LEAK: closure captures largeData even though it never uses it
function setupHandler() {
  const largeData = new Array(100_000).fill({ x: Math.random() }); // ~8MB

  const button = document.getElementById('btn');
  button.addEventListener('click', function handler() {
    console.log('clicked');  // handler captures largeData but NEVER reads it
  });

  // largeData cannot be GC'd while handler is alive
  // handler is alive while button exists
  // button may exist for the entire app lifetime
}
// ✅ FIX 1: Process data immediately, don't hold the reference
function setupHandler() {
const largeData = new Array(100_000).fill({ x: Math.random() });
const summary = processData(largeData); // extract what you need
// largeData goes out of scope and can be GC'd
document.getElementById('btn').addEventListener('click', () => {
console.log('summary:', summary); // closure holds summary, not largeData
});
}
// ✅ FIX 2: Explicitly null out large objects when done
function setupHandler() {
let largeData = new Array(100_000).fill({ x: Math.random() });
const summary = processData(largeData);
largeData = null; // allow GC immediately
// …
}The V8 optimization note: Modern V8 can sometimes detect that a closure does not actually use a variable and avoid capturing it. But this optimisation is not guaranteed — never rely on it. Explicit null-out is always safer.
Pattern 5 — React useEffect Cleanup Memory Leak
Every React useEffect cleanup memory leak traces back to the same omission: a missing return function. The most common React-specific leak — effects that add subscriptions, intervals, or event listeners without returning a cleanup function leak on every component unmount.
// ❌ LEAK: new listener added every time component mounts — never removed
function LiveChart({ symbol }) {
  const [price, setPrice] = useState(null);

  useEffect(() => {
    const socket = new WebSocket(`wss://prices.example.com/${symbol}`);

    socket.addEventListener('message', (event) => {
      setPrice(JSON.parse(event.data).price);
    });

    // No return → no cleanup → socket never closed
  }, [symbol]);
}
The Modern Cleanup Pattern — AbortController Unified
The canonical modern pattern: one AbortController cancels fetch, event listeners, AND timer waits. This replaces the legacy isMounted flag entirely. The addEventListener signal option means the listener auto-removes when the controller aborts:
function LiveChart({ symbol }) {
  const [price, setPrice] = useState(null);
  const [data, setData] = useState(null);

  useEffect(() => {
    const controller = new AbortController();
    const { signal } = controller;

    // 1. Fetch — abort cancels the request
    fetch(`/api/history/${symbol}`, { signal })
      .then(r => r.json())
      .then(setData)
      .catch(err => {
        if (err.name === 'AbortError') return; // normal — ignore
        // …handle real errors
      });

    // 2. WebSocket message handler — auto-removed when signal aborts
    const socket = new WebSocket(`wss://prices.example.com/${symbol}`);
    socket.addEventListener('message', (event) => {
      setPrice(JSON.parse(event.data).price);
    }, { signal });

    // 3. Window resize handler — same signal, auto-cleanup
    window.addEventListener('resize', handleResize, { signal });

    return () => {
      controller.abort();  // ONE call cleans up everything above
      socket.close();      // WebSocket close still needs explicit call
    };
  }, [symbol]);
}
{ signal } on every addEventListener is the key: when controller.abort() runs, every listener registered with that signal is automatically removed — no need to keep references to handler functions.
Pattern 6 — Observer Leaks (ResizeObserver / IntersectionObserver)
A leak class most articles miss entirely. ResizeObserver and IntersectionObserver must be explicitly disconnected — they leak in all browsers if you don’t. MutationObserver is the asymmetric exception: it auto-cleans when its observed node is GC’d, but the resize/intersection observers don’t.
| Observer | Auto-cleanup when target is GC’d? | Required teardown |
|---|---|---|
MutationObserver | ✅ Yes | None (but explicit disconnect() still good practice) |
ResizeObserver | ❌ No — leaks | observer.disconnect() |
IntersectionObserver | ❌ No — leaks | observer.disconnect() |
PerformanceObserver | ❌ No — leaks | observer.disconnect() |
// ❌ LEAK: observer keeps holding callback + observed elements
function trackVisibility(element, onVisible) {
  const observer = new IntersectionObserver(([entry]) => {
    if (entry.isIntersecting) onVisible();
  });
  observer.observe(element);
  // No disconnect → observer + callback live forever
}

// ✅ FIX: return a cleanup function — or use a signal
function trackVisibility(element, onVisible) {
  const observer = new IntersectionObserver(([entry]) => {
    if (entry.isIntersecting) onVisible();
  });
  observer.observe(element);
  return () => observer.disconnect();
}

// In React
useEffect(() => {
  const observer = new ResizeObserver((entries) => { /* … */ });
  observer.observe(ref.current);
  return () => observer.disconnect();
}, []);
This is a known Chromium and WebKit issue, not user error — the spec leaves cleanup to authors. If you instantiate an observer and forget disconnect(), the observer plus every observed node plus every closure variable stays in memory.
The Three-Snapshot Technique — The Chrome DevTools Heap Snapshot Workflow
The Chrome DevTools heap snapshot is your primary instrument — here’s the three-snapshot technique. The only reliable workflow for confirming and locating a memory leak. It eliminates false positives from lazy GC and one-time allocations.
Step 1 — Baseline snapshot
- Open the page in an Incognito window (excludes extension memory)
- DevTools → Memory tab → Heap snapshot → Take snapshot (name it “Baseline”)
- Click the GC button (trash icon) to force garbage collection
Step 2 — Trigger the suspected leak
- Perform the action you suspect is leaking: navigate to a page and back, open and close a modal, click a button several times
- Click GC again
Step 3 — Post-action snapshot
- Take a second snapshot (name it “After action”)
- In the comparison view (dropdown at top), select Comparison and compare to Baseline
- Sort by Size Delta — positive deltas are objects that grew
Step 4 — Confirm it is a leak, not a one-time cost
- Repeat the action 5–10 more times
- Take a third snapshot — compare to “After action”
- If Size Delta keeps growing with each repeat → confirmed leak
- If Size Delta is roughly zero → probably a one-time allocation, not a leak
queryObjects(Constructor) — the 10-Second Leak Hunter
Chrome’s Console Utilities API has an underused trick: queryObjects(MyClass) enumerates every live instance of a constructor in the heap. No snapshot required.
// In the Chrome DevTools console — type any of these
queryObjects(Promise);          // every live Promise
queryObjects(HTMLDivElement);   // every live <div>
queryObjects(MyComponent);      // every live React component instance

// The console returns an array. If the count keeps growing across
// user actions that should be releasing instances, you've found
// the leak class. Then queryObjects(MyComponent)[0] inspects one
// to walk its retainers.
This is the single highest-leverage DevTools trick most developers don’t know. Pair it with the three-snapshot technique to confirm “the count keeps growing” instead of guessing.
Choosing Among the Three Memory Profiling Modes
Chrome’s Memory panel offers three modes. Readers often ask “which one do I use?”:
| Mode | Best for | Overhead | When to pick |
|---|---|---|---|
| Heap Snapshot | Finding what is retained right now | None (one-shot) | Three-snapshot technique, queryObjects follow-up |
| Allocation instrumentation on timeline | Finding who allocated, with stack traces, live recording | High | When a snapshot shows growth but you don’t know where it came from |
| Allocation sampling | Long sessions where instrumentation overhead matters | Low (statistical sampling) | Production-like profiling, week-long suspect sessions, mobile devices |
Start with Heap Snapshot. Move to Allocation instrumentation if you need to see the JS stack that allocated a retained object. Use Allocation sampling for long sessions where the high-overhead mode would skew results.
Retained Size vs Shallow Size (The Columns Nobody Explains)
These two columns appear in every heap snapshot.
Shallow Size — the memory used by the object itself, not counting any objects it references. For a small object that points to a large array, the shallow size is tiny (just the pointer fields).
Retained Size — the memory that would be freed if this object were removed. Includes all objects reachable only through this object. This is the number that matters for finding leaks.
const cache = new Map(); // shallow size: small (just the Map structure)
cache.set('key', new Array(1_000_000).fill(0)); // retained size: ~8MB
Rule: Sort by Retained Size descending to find the most impactful leak sources. Sorting by Shallow Size shows the object with the most own memory, which is usually not the leak root.
WeakMap, WeakRef, and FinalizationRegistry — Modern Prevention Tools
// WeakMap: cache that auto-evicts when the key is GC'd
const domMetadata = new WeakMap();

function annotateNode(element, data) {
  domMetadata.set(element, data); // element is the key
}

// When element is removed from DOM and all references drop:
// → element becomes unreachable
// → WeakMap entry is auto-removed
// → data is freed
// Zero manual cleanup required

// WeakRef: hold a reference that does not prevent GC
class ImagePool {
  constructor() {
    this._cache = new Map();
  }

  get(key) {
    const ref = this._cache.get(key);
    if (!ref) return null;

    const img = ref.deref(); // returns the object or undefined if GC'd
    if (!img) {
      this._cache.delete(key); // clean up stale entry
      return null;
    }
    return img;
  }

  set(key, img) {
    this._cache.set(key, new WeakRef(img));
  }
}
FinalizationRegistry — Useful Trap, Not a Safety Net
FinalizationRegistry lets you register a callback to run “when an object is garbage collected.” It sounds perfect for leak detection — but MDN, V8’s docs, and the TC39 spec all carry the same warning: callbacks may run late, may run at unpredictable times, and may not run at all (notably when the runtime shuts down).
// ⚠️ Useful for diagnostics, NEVER for required cleanup
const reg = new FinalizationRegistry((label) => {
  console.log(`${label} was garbage collected`);
});

const obj = { name: 'thing' };
reg.register(obj, 'My big object');

// Later, when obj has no references and the GC runs:
// → "My big object was garbage collected" (maybe — eventually)
Use it for: dev-time logging to confirm an object IS being collected when you fix a leak. Never use it for: closing a database connection, releasing a file handle, removing an event listener, or anything else that MUST happen. Use explicit teardown for required cleanup — AbortController.abort(), observer.disconnect(), clearInterval().
When to use each
| Tool | Use when |
|---|---|
WeakMap | Associating metadata with DOM nodes or objects you don’t own |
WeakSet | Tracking “has this object been processed” without preventing GC |
WeakRef | Building caches where you want entries to auto-expire when unused |
FinalizationRegistry | Diagnostic logging only — not required cleanup |
AbortController | Unified cleanup for fetch + listeners + observers |
Manual null | The simplest fix — often all you need |
Production Telemetry — performance.measureUserAgentSpecificMemory()
Local DevTools can’t catch slow leaks that only show up at scale. The deprecated performance.memory.usedJSHeapSize only works in Chrome and is being phased out. The modern replacement is performance.measureUserAgentSpecificMemory():
// Modern, cross-origin-isolated production memory measurement
async function measureMemory() {
  if (!performance.measureUserAgentSpecificMemory) return null;
  try {
    const result = await performance.measureUserAgentSpecificMemory();
    return result.bytes; // total memory used by this realm
  } catch (e) {
    // SecurityError: page is not cross-origin isolated (no COOP/COEP)
    return null;
  }
}

// Poisson-sample to avoid measuring on every pageview
function scheduleMeasurement() {
  const mean = 5 * 60 * 1000; // ~5 minutes
  setTimeout(async () => {
    const bytes = await measureMemory();
    if (bytes != null) analytics.send('memory', { bytes });
    scheduleMeasurement();
  }, -Math.log(Math.random()) * mean);
}
Requirements: your page must be cross-origin isolated — serve Cross-Origin-Opener-Policy: same-origin and Cross-Origin-Embedder-Policy: require-corp headers. Use Poisson sampling rather than fixed intervals so memory measurements don’t cluster around predictable times.
Key Takeaways
- A memory leak is an object that is logically unused but technically reachable — the GC cannot free it because a reference still exists somewhere
- The six most common patterns are: unbounded caches,
setIntervalwithoutclearInterval, detached DOM nodes, closures capturing large objects, React effects without cleanup, and observer leaks (ResizeObserver/IntersectionObserver) - Use the three-snapshot technique to confirm a leak is real: baseline → action → repeat action → compare the delta of both comparisons
queryObjects(Constructor)in the DevTools console enumerates live instances — the 10-second leak hunter- Sort by Retained Size, not Shallow Size — retained size shows how much memory would actually be freed if you fixed the leak
- Filter the heap snapshot summary by
Detachedto instantly find all detached DOM nodes and the variable holding each one - Always save the return value of
setInterval— an interval with no reference cannot be cleared - Return a cleanup function from every
useEffectthat creates a subscription, timer, socket, or event listener AbortControlleris the unified cleanup — one signal cancels fetch, WebSocket message handlers, AND event listeners (via thesignaloption onaddEventListener)- ResizeObserver and IntersectionObserver leak in all browsers if not explicitly disconnected; MutationObserver is the asymmetric exception
WeakMapandWeakRefare the right tools for caches keyed by DOM nodes or objects you do not control — entries auto-expire without manual managementFinalizationRegistrycallbacks may run late or never — use them for dev-time diagnostics, never as a safety net for required cleanupperformance.measureUserAgentSpecificMemory()is the modern production-memory API — requires cross-origin isolation, replaces the deprecatedperformance.memory- Always profile in an Incognito window — browser extensions pollute the heap with their own allocations
- Chrome Task Manager (Shift+Esc) is the fastest triage step — sort by Memory and watch for monotonic growth before opening DevTools
FAQ
How do I know if my app has a memory leak without opening DevTools?
The fastest check is Chrome’s Task Manager — Shift+Esc, sort by Memory, use your app for a minute. If your tab’s row grows monotonically and never drops, you have a leak. The clearest symptom is progressive slowdown: the app feels fine when first loaded but gets sluggish after 10–15 minutes of use or after navigating between pages several times. A one-time memory spike that stabilises is normal — memory that never stops growing is a leak.
Does removing a DOM element also remove its event listeners?
Yes — if the element has no JavaScript references pointing to it. The browser stores event listeners in the element itself, so when the element is GC’d, its listeners are freed too. The problem is when your JavaScript keeps a reference to the element (like cachedList = element in Pattern 3). That reference prevents GC, which means both the element and its listeners stay alive.
What is the difference between a memory leak and high memory usage?
High memory usage means the app allocates and holds a lot of memory — but the amount stays stable over time. A memory leak means the amount keeps growing with use. Check the pattern over time: if memory plateaus after initial load and usage, that is high (possibly too high) but not leaking. If memory grows every time you open a modal or navigate, that is a leak.
Why does my heap snapshot show thousands of closure objects?
Closures are not inherently leaks — every function defined inside another function creates a closure. The question is whether those closures are retained longer than necessary. Look for closures with a large Retained Size and check their retainer chain. If a closure is retained by a long-lived object (a Map, a global variable, a timer) when it should have been freed, that is the leak.
WeakMap vs Map memory — which should I use for a cache?
Use WeakMap when your keys are objects (DOM nodes, request objects, components) — entries auto-evict when the key has no other references, with zero manual cleanup. Use a regular Map with explicit eviction (size limit, TTL, or LRU) when your keys are primitives (strings, numbers) — WeakMap doesn’t accept primitive keys. Practical example: associating metadata with DOM nodes → WeakMap; caching API responses keyed by URL → Map with MAX_CACHE eviction.
Why is clearInterval not working in my component?
Three common causes. (1) You’re calling clearInterval on a different ID than setInterval returned — the variable was reassigned or re-rendered in a closure. (2) You’re calling it in a useEffect with the wrong dependency array, so the cleanup never runs at the right time. (3) The ID was saved to a re-rendered closure — every render creates a new intervalId variable, but only the original one points at the running interval. Fix: store the ID in a useRef if you need it across renders, or always pair setInterval with its clearInterval in the SAME useEffect cleanup.
How to find a memory leak in Chrome without writing code?
Two steps with no code: (1) Shift+Esc opens Chrome’s Task Manager — sort by Memory, use your app, watch for monotonic growth. (2) DevTools → Memory tab → take three heap snapshots with a user action between each, then sort the comparison by Size Delta. The constructor with positive deltas that grow each round is the leak. Then queryObjects(Constructor) in the console enumerates live instances so you can inspect one.
Can WeakMap always replace a regular Map for caching?
No. WeakMap keys must be objects — you cannot use strings, numbers, or other primitives as keys. If your cache key is a string (like a URL or an ID), you need a regular Map with explicit eviction logic (size limit, TTL, or LRU). Use WeakMap when your keys are DOM nodes, request objects, or other non-primitive entities.
How is this different in Node.js?
Same GC, different tools. In Node: process.memoryUsage() returns RSS, heap total, heap used, external, and arrayBuffers. The CLI flag --max-old-space-size=4096 raises the heap limit (default ~1.5GB) and --heapsnapshot-near-heap-limit=3 automatically writes .heapsnapshot files when the heap approaches the limit. Those files open directly in Chrome DevTools (Memory tab → Load profile). Common Node-specific leak sources: unbounded EventEmitter listeners (use emitter.setMaxListeners() and explicit removeListener in shutdown), connection pools without pool.end(), and module-level caches that grow per request.
How do I fix a memory leak in a third-party library I do not control?
You cannot change the library’s code, but you can control when it is active. Ensure you call the library’s cleanup or destroy method on component unmount. If the library has no cleanup API, file a bug and work around it by limiting how often you instantiate the library — reuse a single instance rather than creating a new one per render.