Collection D3.js Patterns & Templates. Find D3.js Patterns & Templates demo links and source.
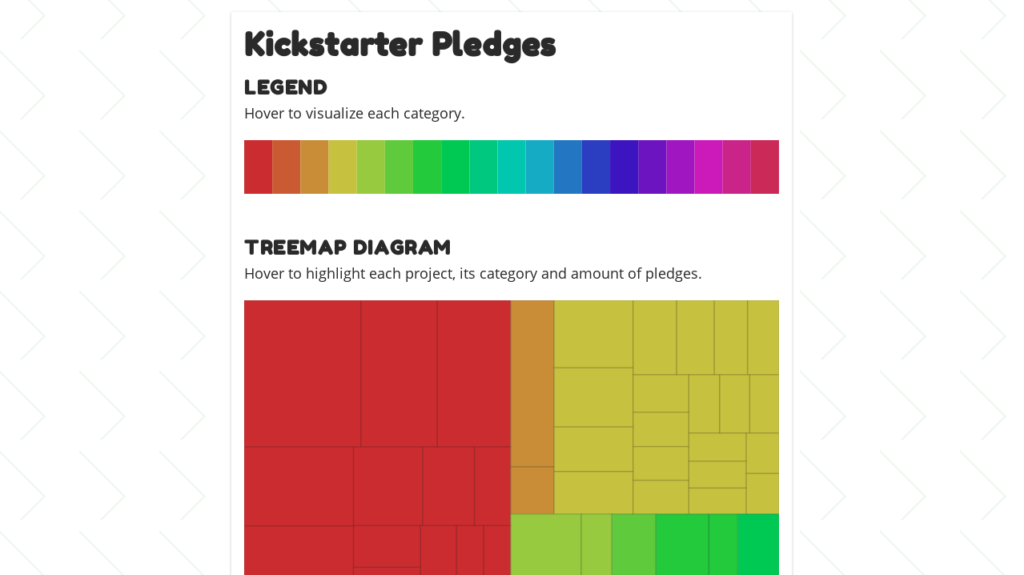
D3 Hierarchy
Highlight Kickstarter’s pledges through multiple layouts and hierarchical visualizations.
 Demo image: D3 Hierarchy
A Demo by Gabriele Corti on CodePen.
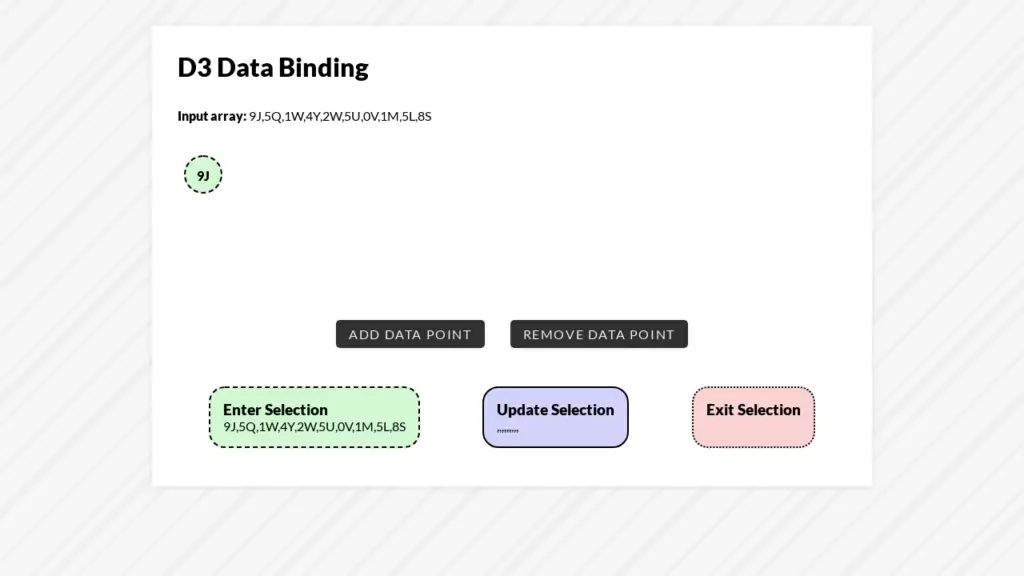
D3 Data Binding
Describe how D3 binds data to node elements, highlighting the enter-update-exit loop and object constancy.
 Demo image: D3 Data Binding
A Demo by Gabriele Corti on CodePen.
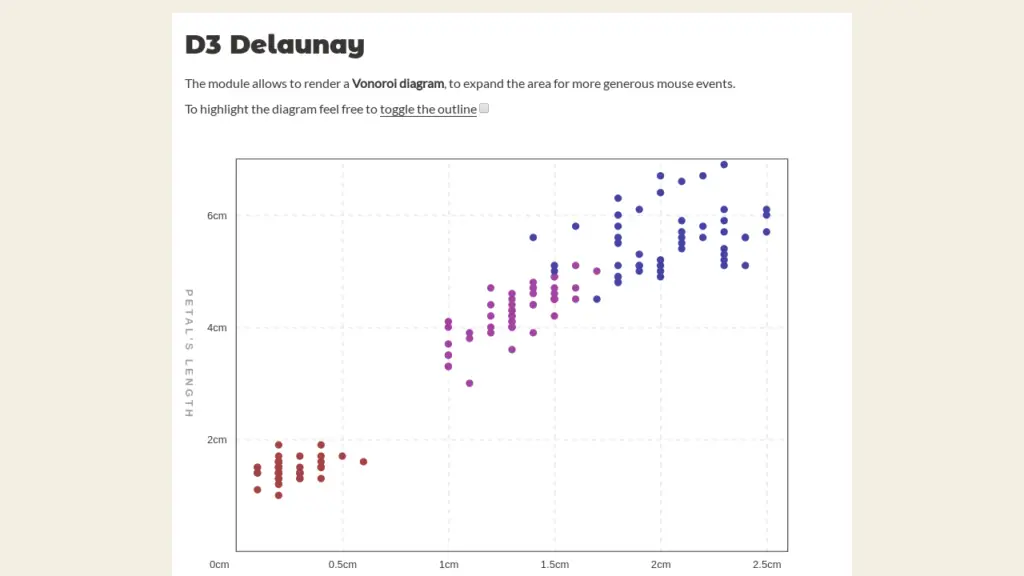
D3 Delaunay
Practice with the D3 Delaunay module to expand the area for mouse interaction.
Links
 Demo image: D3 Delaunay
A Demo by Gabriele Corti on CodePen.
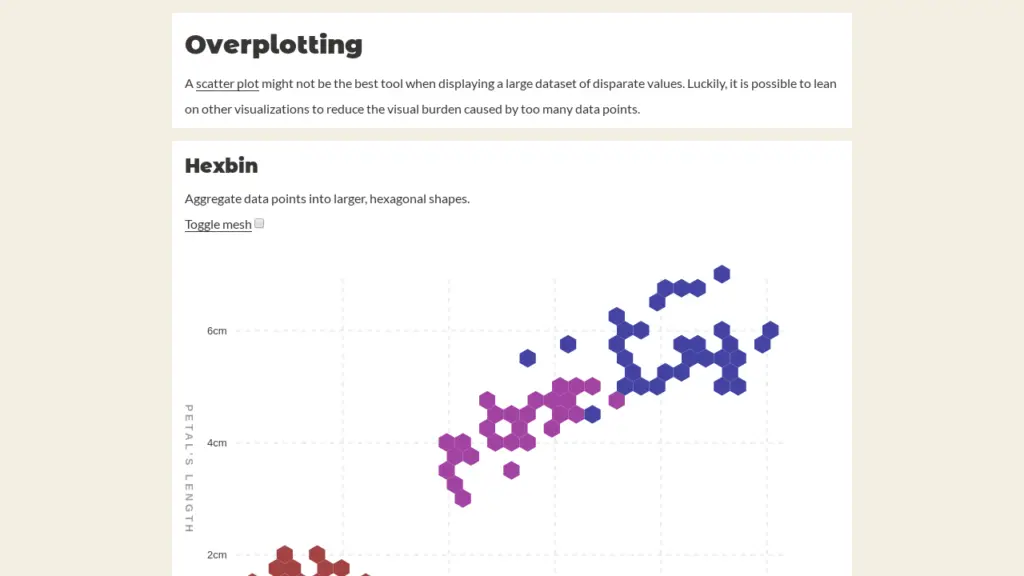
D3 Hexbin & Contour
Explore the d3-hexbin and d3-contour modules to analyse two approaches addressing overplotting.
Links
- Previous project. The scatter plot was built to showcase the Delaunay package but is used as a starting point for the style and overall structure.
- D3 Hexbin. Be sure to import the package as it is separate from the
d3library. - D3 Contour. Incorporated in the main library.
 Demo image: D3 Hexbin & Contour
A Demo by Gabriele Corti on CodePen.
D3 Array
Explore the D3 Array module and some of the convenience methods provided by the library.
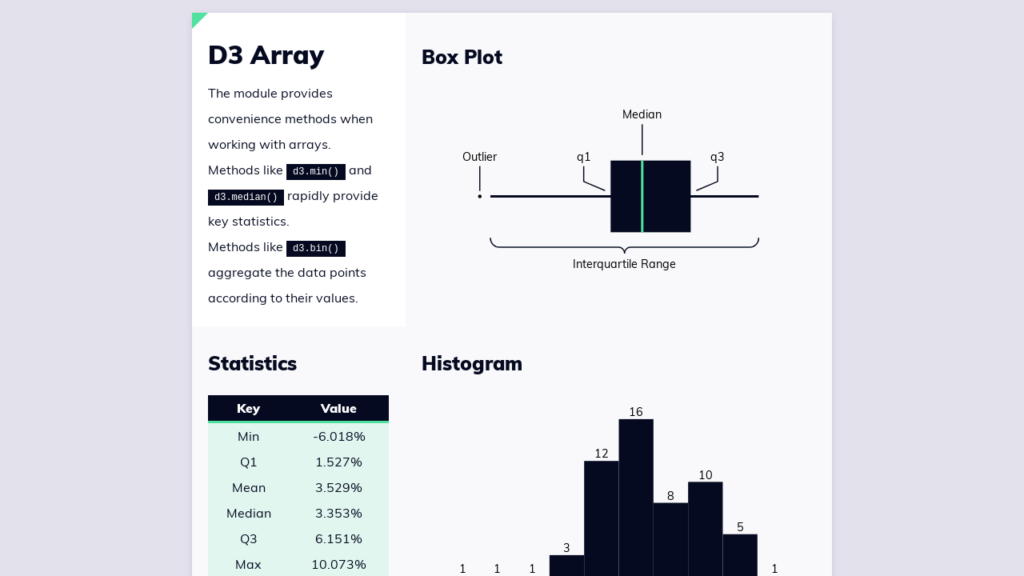 Demo image: D3 Array
A Demo by Gabriele Corti on CodePen.
D3 Bar Plot Template
Create a template for visualizations describing a categorical and a numerical variable.
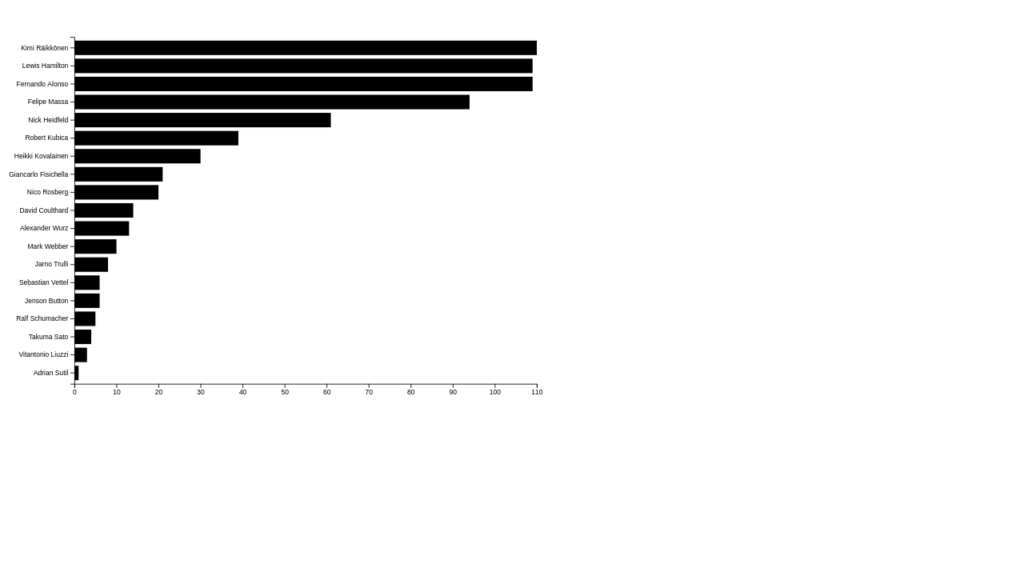 Demo image: D3 Bar Plot Template
A Demo by Gabriele Corti on CodePen.
D3 World
Create a template for data visualization relying on a map of the world.
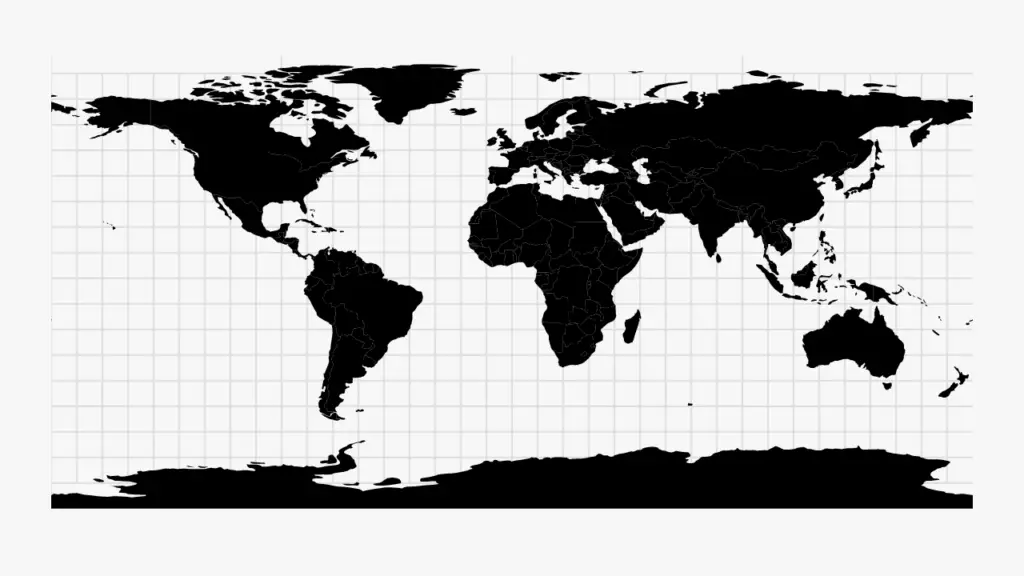 Demo image: D3 World
A Demo by Gabriele Corti on CodePen.
D3 Scatter Plot Template
Create a template for a scatter plot, illustrating the relation between two numerical variables with linear scales and unstyled axes.
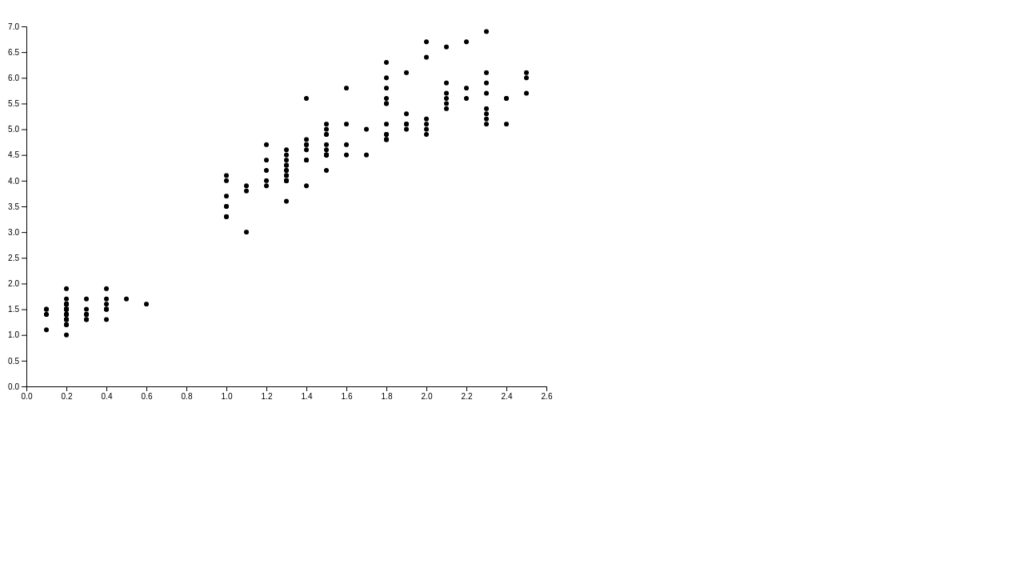 Demo image: D3 Scatter Plot Template
A Demo by Gabriele Corti on CodePen.
D3 Line Chart Template
Create a template for visualizations plotting the evolution of a numerical variable over a time frame.
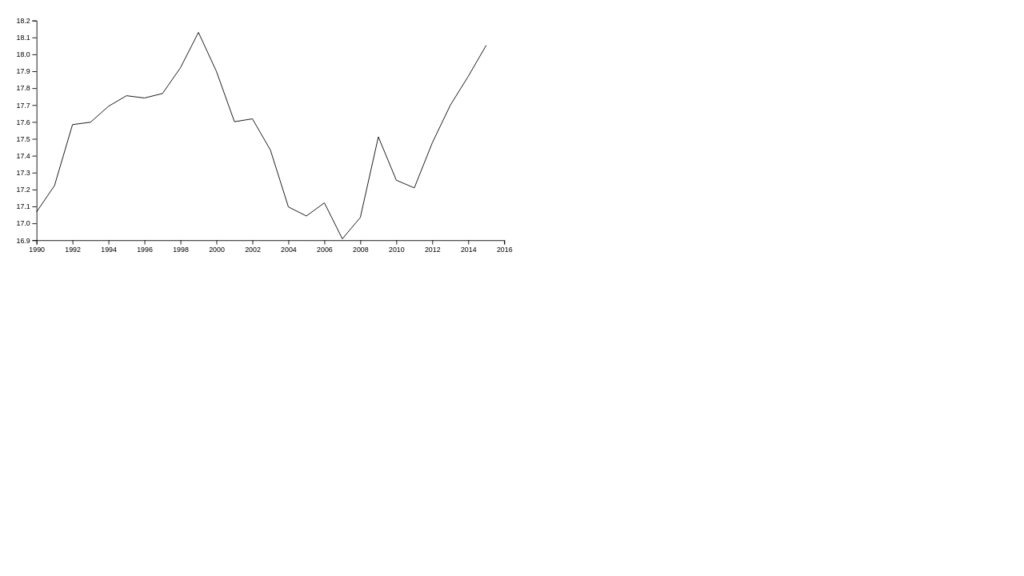 Demo image: D3 Line Chart Template
A Demo by Gabriele Corti on CodePen.